In this cruel world of bugs that we live in, it’s important that we learn how to deal with them effectively. Properly using the tools that we have at our disposal can make a huge impact on the time we need to dedicate to finding bugs. Visual Studio provides a lot of debugging features, so let’s check out some of them which might help you.
Step in / Step over
This is the most basic process of debugging, it’s not really a unique feature nor worth mentioning. BUT! I’ve seen a lot of people using them without the hotkeys, which really impacts your debugging speed. So, short tip: use the hotkeys (F10/F11)!
Manually changing values in runtime
By hovering the mouse over properties and variables, we can check their current value. But it becomes even better: we can change the value to whatever we want, as long as it is of the same type, otherwise Visual Studio will kindly complain.
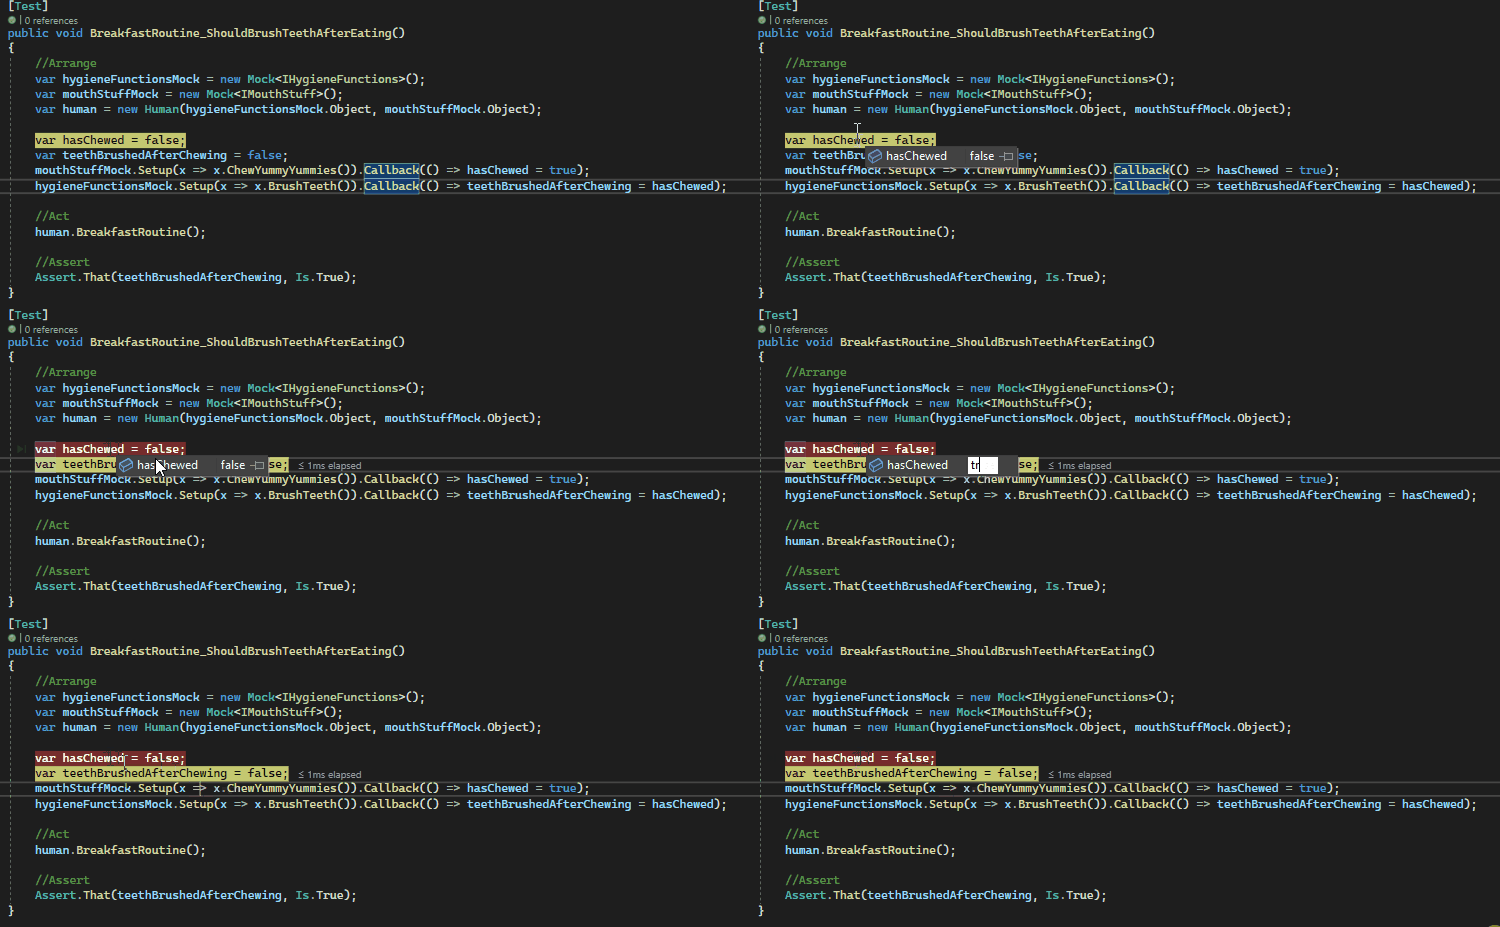
But there’s a caveat: you will only be able to do so if you have access to the setter. For example, let’s define 2 basic classes:
public class SuperSimpleDataClass
{
    public string SuperSimpleProperty { get; }

    public SuperSimpleDataClass(string superSimpleProperty)
    {
        SuperSimpleProperty = superSimpleProperty;
    }
}
public class SuperSimpleRunner
{
    public void SuperSimpleMethod(SuperSimpleDataClass data)
    {
        data.ToString();
    }
}
If we were to debug the SuperSimpleMethod, we wouldn’t be able to fiddle with the data’s SuperSimpleProperty, since it doesn’t have a setter.
Immediate window
Another great tool, we can also use it to change variables and properties values. But it’s more powerful since we can use it to call other methods, which may or may not change a value. You can even create and populate new variables, so it is very useful in order to investigate different scenarios while debugging.
Watcher
This one is really useful to keep track of variables, as well as dissect them. You can add any variable to it, and it will automatically load all its values. And as you progress through your debugging journey, it will mark in red the ones that have changed. Oh, you can also add expressions to it.
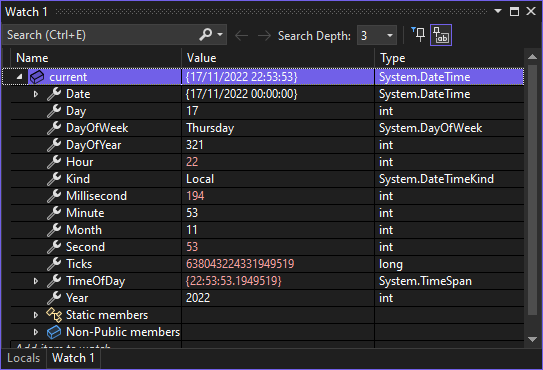
Update: As Leszek suggest in the comments, you can also use the Watcher to have a json visualization of a class, or even export it. For example, if you add a new item similar to this:
Newtonsoft.Json.JsonConvert.SerializeObject(yourVariableName, Newtonsoft.Json.Formatting.Indented)
Then you can use the Json visualizer to inspect or export your variable.
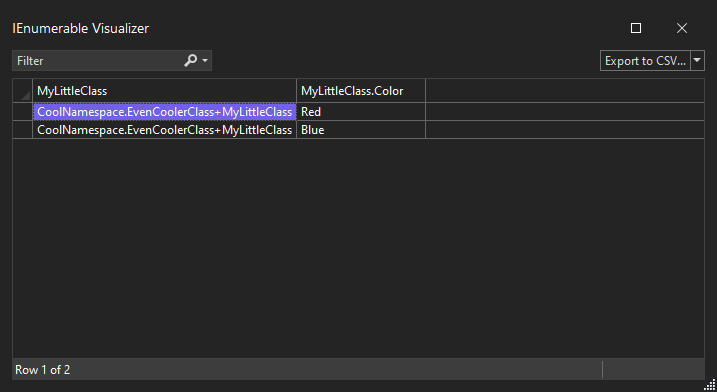
Also, Michał mentioned the recently added IEnumerable visualizer. It’s great for huge lists due do its Filter functionality. And you can even export it to CSV, super handy. Also, it’s worth mentioning that you also can use this visualizer by hovering your mouse over an IEnumerable variable.
Conditional breakpoints
Breakpoints are incredibly useful, but sometimes, when we are iterating through a giant for loop, it can be pretty boring to skip until we find what we’re looking for. So, we have the conditional breakpoints to save us. Speaking of which, are you aware of how much specifying a list’s capacity can help your performance?
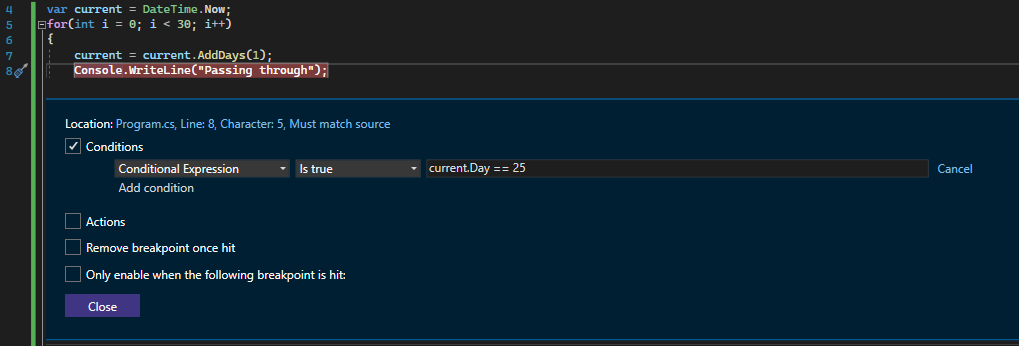
We can open its window by right-clicking on an existing breakpoint and then on “Conditions”. If we configure it correctly, we can set it so the breakpoint is only hit precisely when we want. In the example below, it will only be hit when the current Day of the variable named current is exactly 25. Just a heads up: it will significantly slow down your program’s performance, so don’t worry if suddenly your code is slow as hell.
Yellow arrow dragging
This is a terrible name and definitely not the right one, sorry for that. But the thing is, this yellow arrow indicates which is the next piece of code that is going to be executed, right? It was pretty shocking to me to learn that we can drag it around. We can use it to skip a line, run a line again, and so on.
There are some limitations to it, of course. You can’t drag it to another method, you can’t drag it inside or outside a finally statement, and so on. You will figure them out as you go.

Call stack
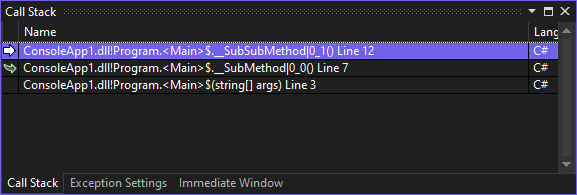
Last but not least we have the Call Stack. It enables us to know how did we end up where we are. And by double clicking on the lines, we are able to get the current context from that method’s perspective. For example, we can check the current values of all variables related to that method.
