
Previously, we were investigating how to generate code coverage data with AltCover, but we were left out without knowing how to actually analyze that data. That’s when NDepend comes to the rescue, it provides us with multiple ways to visualize that data. Besides that, it also helps us keep our code covered when refactoring or creating methods.
Analyzing
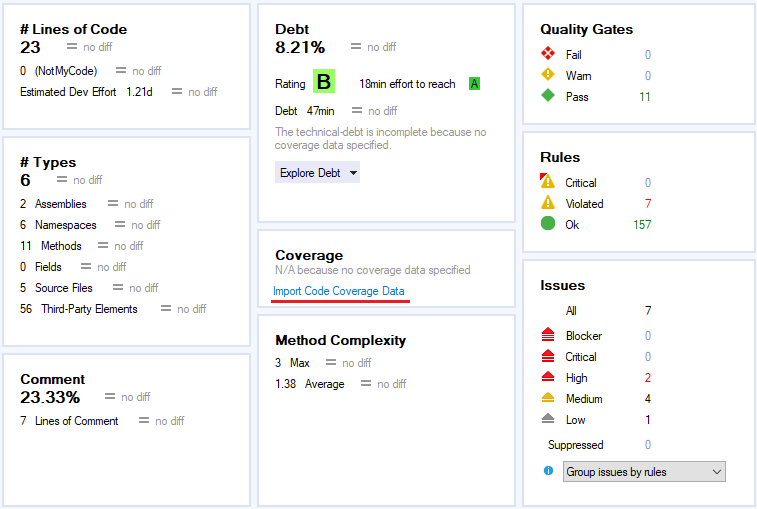
First of all, we need to import our code coverage data. To do so, we need to open the NDepend dashboard from our project and click on “Import Code Coverage Data”.
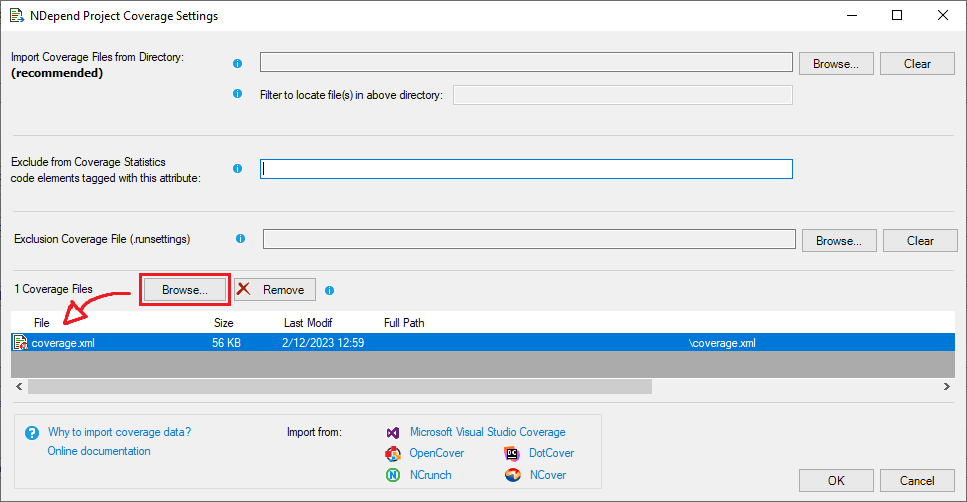
On the next screen, we can choose how we want to import the coverage data. There are different ways to achieve that. For example, we can choose to import all files in a folder, or maybe we just want to import a specific one. In our case, we will go with the latter due to simplicity. So, let’s click on Browse and select our file.
Press OK, and then run an analysis on your project (Extensions > NDepend > Run Analysis). If we return to the dashboard, we can see that we already have some data! Let’s take a look:
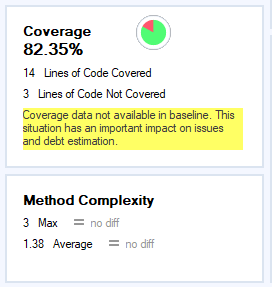
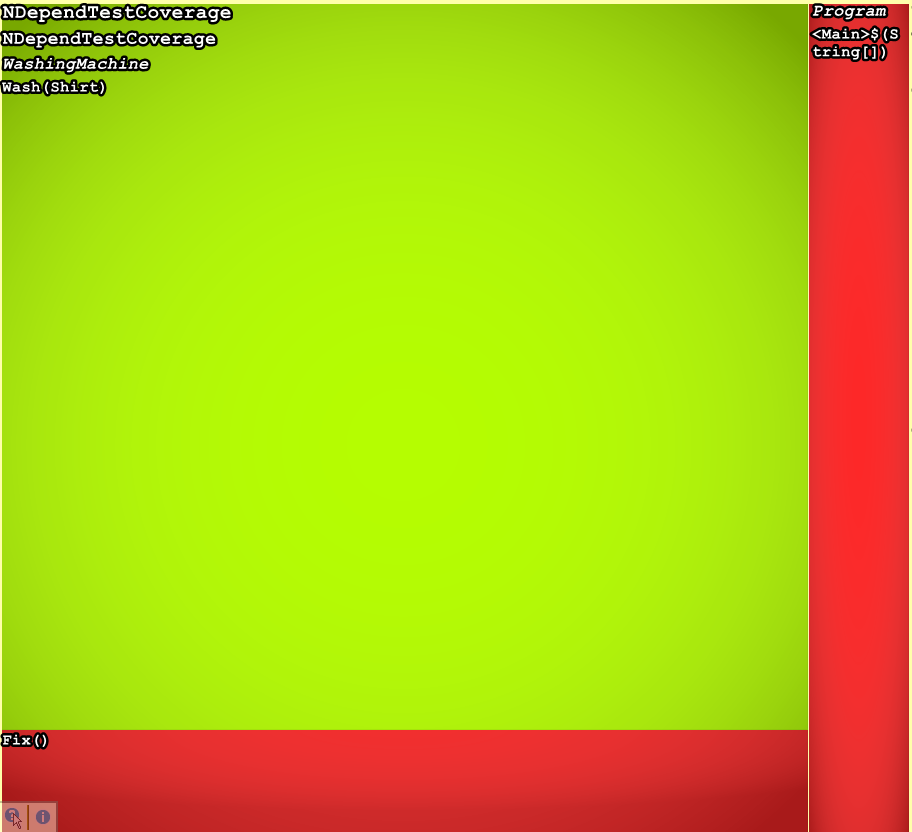
It seems that we are missing some coverage here, but where? Well, NDepend will help us find it out. Let’s explore the Code Metrics View, we can find it in Extensions > NDepend > Explore Code Coverage. By the way, just so we are completely clear here, the name of our current project is now “NDependTestCoverage”. You will see this string in the following images, so it’s good to know where it is coming from.
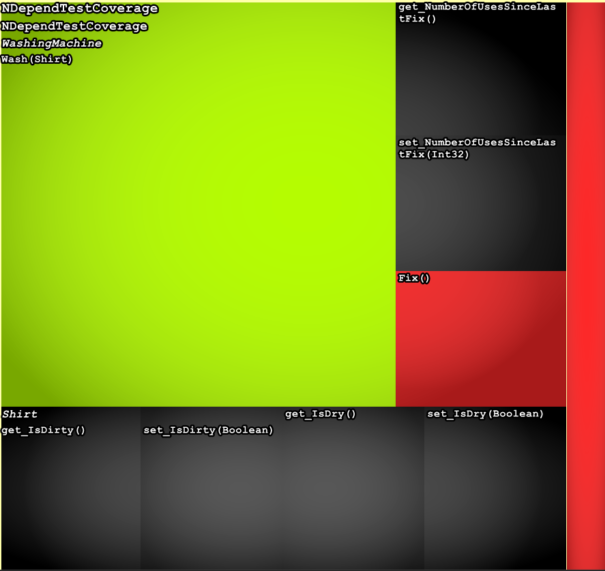
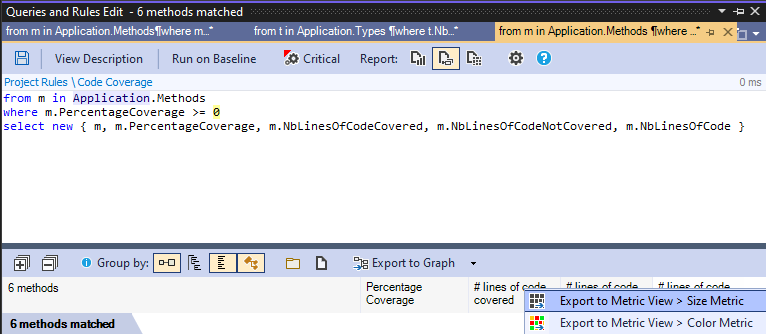
By taking a quick look, we can see that our Fix method is wholly uncovered, since it is bright red, and that the Wash method is partially covered, as it is not exactly green. We also have some black squares, those refer to our auto-set properties, so let’s filter them out. In the Queries and Rules Edit view, let’s replace our query with the following:
from m in Application.Methods
where m.PercentageCoverage >= 0
select new { m, m.PercentageCoverage, m.NbLinesOfCodeCovered, m.NbLinesOfCodeNotCovered, m.NbLinesOfCode }
After that, click on the following button to export our results to the dashboard:
And that’s it! Now our view should be looking like this:
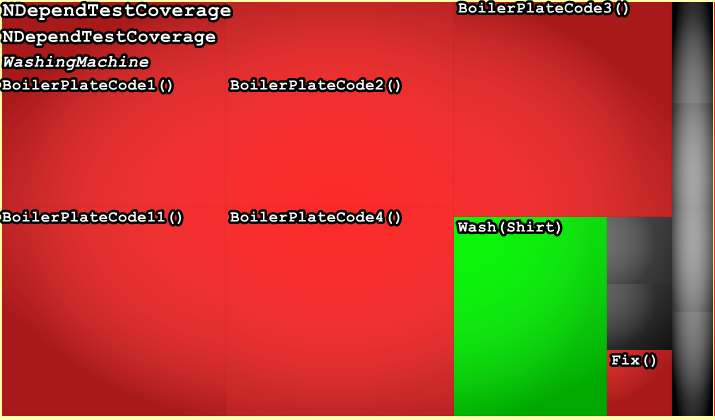
Cleaner right? We can also configure what determines the size of the square. In this case, it is relative to the number of lines in the method. So if we were to have more methods in our class, it could look like this, for example:
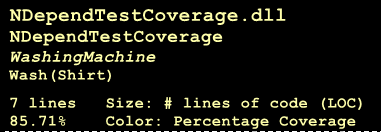
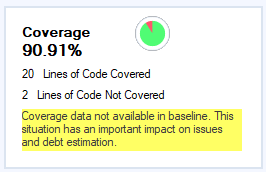
If we hover our mouse above the square corresponding to the Wash method, we can see some more detailed information about it.
Now, let’s fix our missing tests for the Wash method. Let’s review the method and our unit tests:
public void Wash(Shirt shirt)
{
    if (NumberOfUsesSinceLastFix == 3)
        throw new Exception("Whoops I seem to be broken again");

    if (!shirt.IsDirty)
        throw new Exception("Why are you even trying to wash this?");

    shirt.IsDirty = false;
    shirt.IsDry = false;
    NumberOfUsesSinceLastFix++;
}
[TestMethod]
public void ShirtIsClean_ShouldThrowException()
{
    //Arrange
    var washingMachine = new WashingMachine();
    var shirt = new Shirt();

    //Act & Assert
    Assert.ThrowsException<Exception>(() => washingMachine.Wash(shirt));
}

[TestMethod]
public void ShirtIsDirty_ShouldSetItToClean()
{
    //Arrange
    var washingMachine = new WashingMachine();
    var shirt = new Shirt()
    {
        IsDirty = true
    };

    //Act
    washingMachine.Wash(shirt);

    //Assert
    Assert.IsFalse(shirt.IsDirty);
}
It seems that we are never testing if our validation on the NumberOfUsesSinceLastFix property is executed, and if we are acting on it. Let’s fix it with this new unit test:
[TestMethod]
public void MachineHasBeenUsedThreeTimes_ShouldThrowExcepetion()
{
    //Arrange
    var washingMachine = new WashingMachine();
    var shirt = new Shirt();
    washingMachine.NumberOfUsesSinceLastFix = 3;

    //Act & Assert
    Assert.ThrowsException<Exception>(() => washingMachine.Wash(shirt));
}
That should do the trick. Now, let’s generate a new code coverage file and run another analysis on our project. Since we are outputting the .XML file in the same folder with the same name, NDepend will automatically re-analyze the new document. And now, we should have the following result:
And that’s it! This is just one of the many to visualize your data. With the query editor, we can create queries to gain various other insights. For bigger projects, we can also start analyzing by namespace, for example, and then drill down to the methods to find where we are missing coverage.